
Reason to trust
![]()
Strict editorial policy that focuses on accuracy, relevance, and impartiality
Created by industry experts and meticulously reviewed
The highest standards in reporting and publishing
Strict editorial policy that focuses on accuracy, relevance, and impartiality
Morbi pretium leo et nisl aliquam mollis. Quisque arcu lorem, ultricies quis pellentesque nec, ullamcorper eu odio.
Este artículo también está disponible en español.
Despite high optimism among Cardano (ADA) supporters, a look at the weekly chart (ADA/USDT) suggests the exuberance may be premature. While bullish sentiment has grown in tandem with recent regulatory nods, ADA’s price action remains under critical resistance, flashing cautionary signals such as a bearish engulfing pattern.
Cardano: Rising Hype Vs. Bearish Technicals
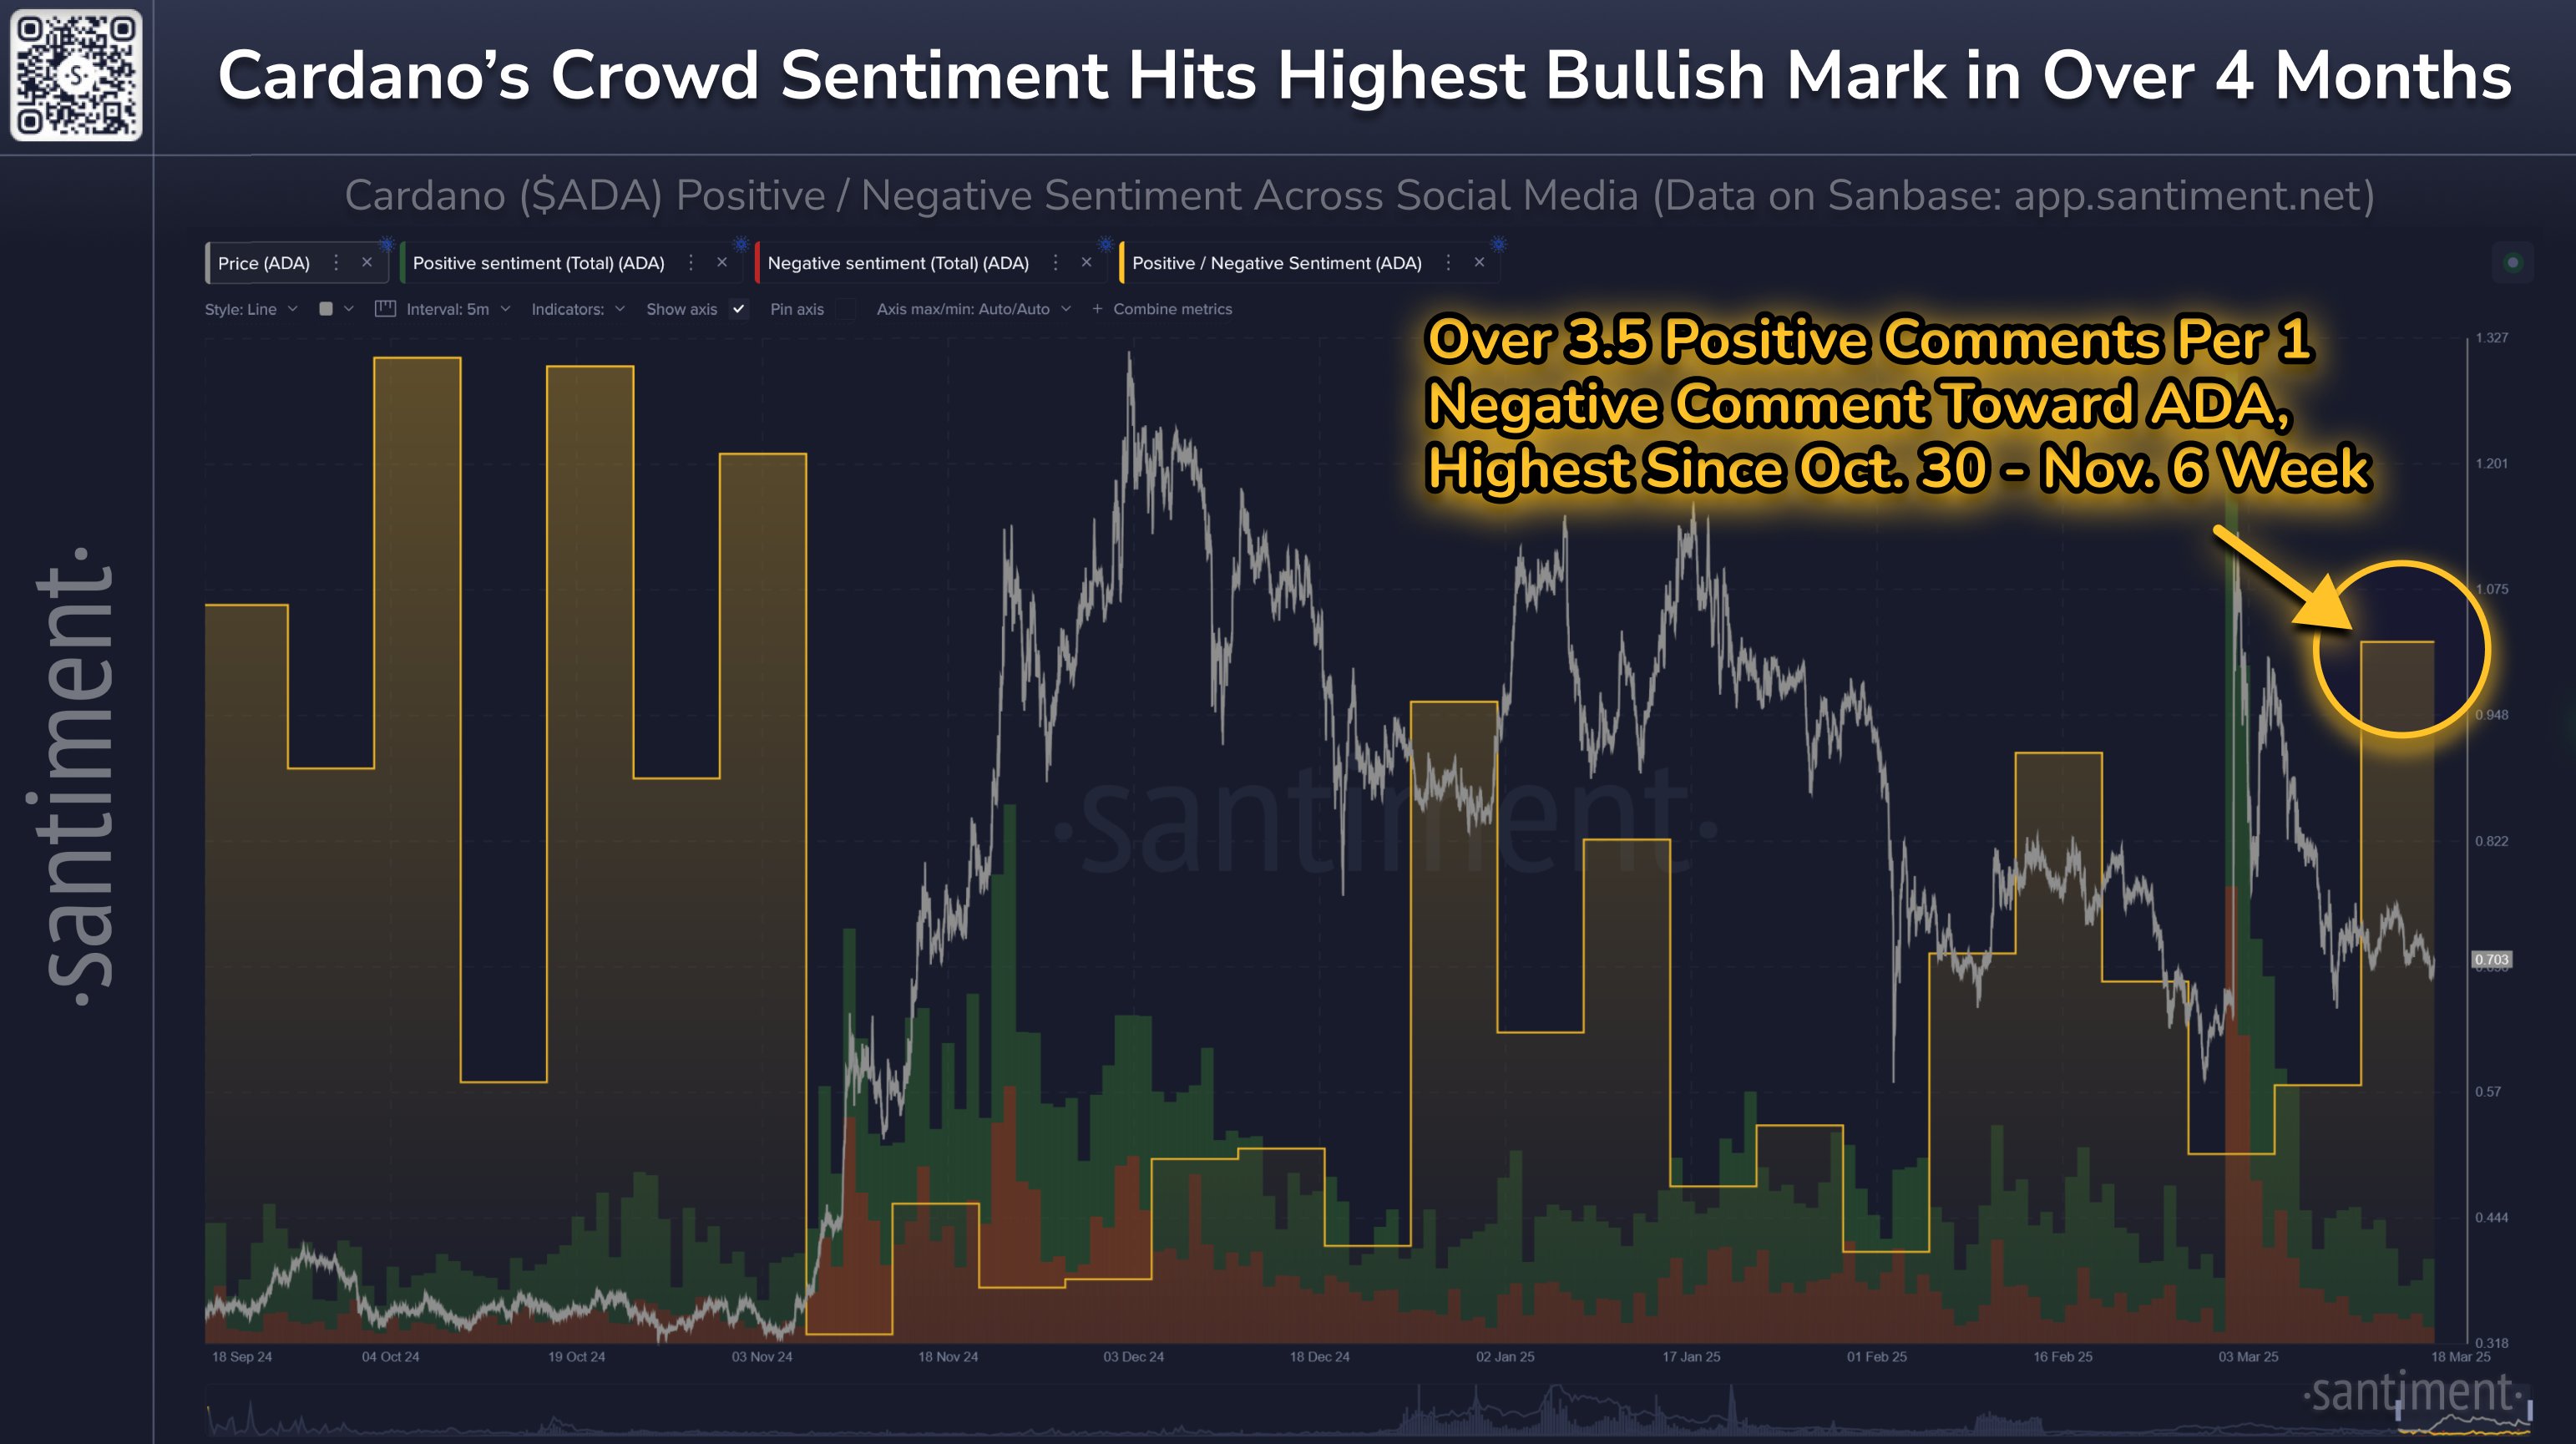
On-chain analytics firm Santiment notes today a distinct rise in social media optimism for Cardano on X: “Specific altcoins like Cardano are seeing high positive sentiment on social media. Aided by the fact that the SEC classified ADA’s use case as ‘smart contracts for government services,’ the altcoin’s community has pushed up bullishness to its highest rate in over 4 months.”
Related Reading
Santiment further highlights that Cardano’s crowd sentiment has hit the highest bullish mark in over 4 months. “Over 3.5 positive comments per 1 negative comment toward ADA, highest since Oct. 30 – Nov. 6 week,” Santiment notes.
However, this social media euphoria hasn’t translated in a bullish price action yet. Currently trading around $0.71, ADA has once again pulled back after ADA was announced to be included in the Strategic Crypto Stockpile by US President Donald Trump. Of particular concern to technical traders is the bearish engulfing candle that formed after the announcement and the subsequent retreat. This pattern occurred three weeks ago when the large red candle completely encompassed the prior green candle’s price range, potentially indicating a shift in momentum back toward the bears.
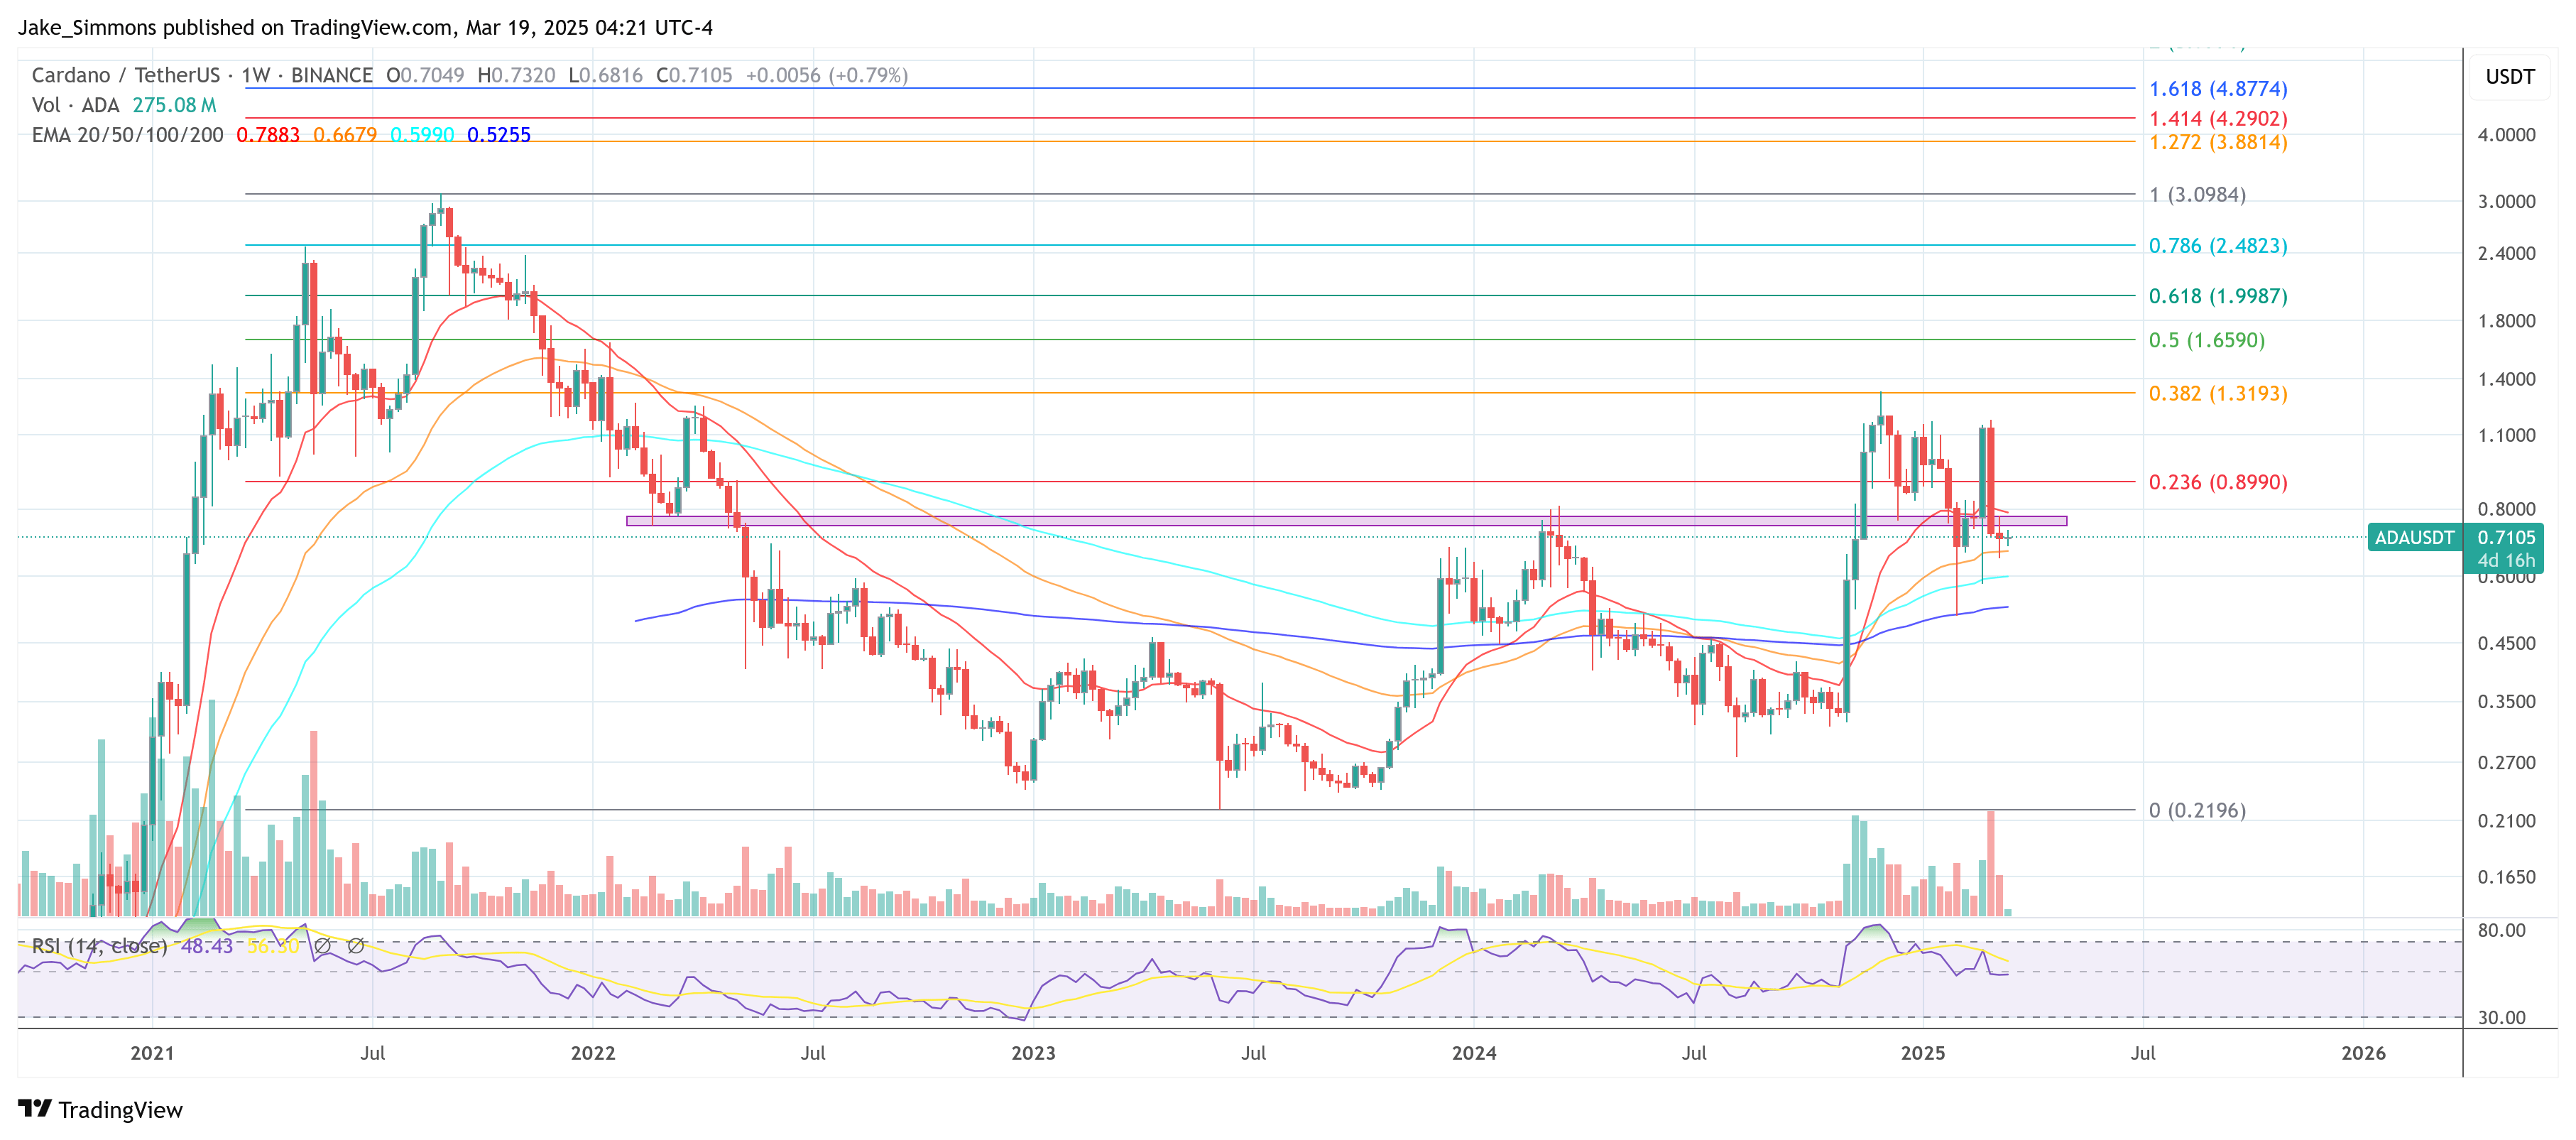
Since then, ADA retraced further. On the moving averages front, Cardano remains sandwiched beneath the 20-week EMA at $0.7883, which itself is trending downward. Below current prices, the 50-week EMA at $0.6679, the 100-week EMA at $0.59, and the 200-week EMA at $0.5255 could act as layered support. If ADA fails to secure a foothold above $0.74-$0.78, these EMAs become increasingly relevant for gauging additional downside risk.
Related Reading
Tracing Fibonacci retracements from the all-time high at $3.0984, the chart reveals additional checkpoints above current resistance. The 0.236 Fib level at $0.8990 stands as the most crucial boundary if bulls can clear $0.78. Beyond that, $1.3193 (0.382 Fib), $1.6590 (0.5 Fib), and $1.9987 (0.618 Fib) represent more distant objectives tied to broader recovery scenarios.
However, the bearish engulfing formation underscores the reality that momentum recently swung back to sellers’ favor. Typically, such a pattern suggests increased downward pressure, at least in the short to medium term, unless a swift upside move reverses the underlying trend. This seems to play out at the moment. The Relative Strength Index (RSI) near 48 confirms this lingering indecision.
Currently, the broader altcoin market currently appears heavily influenced by declining Bitcoin dominance and overarching macroeconomic conditions. All eyes are on today’s FOMC meeting and the updated dot plot, which will be pivotal for risk assets. Any indication of quantitative tightening (QT) easing or dovish signals could serve as a catalyst for renewed strength across the altcoin sector.
Featured image from Shutterstock, chart from TradingView.com